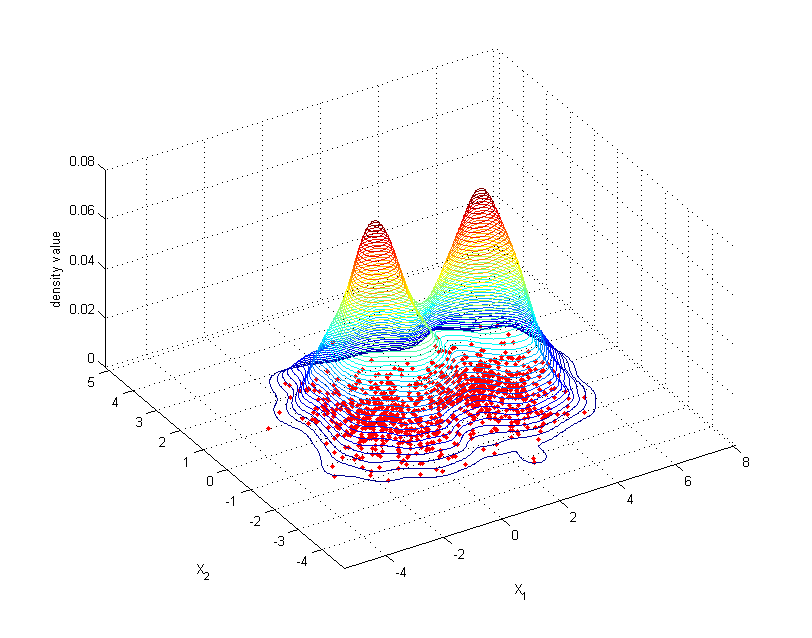
Here's an example of the Hotelling's MV T-test with responses and hypothesized means. Hotelling's MV T-test allows us to use a multivariate analogue of the t-test, comparing the observed values with some hypothesized mean. In this, similar to the univariate case, we assume that the population is Multivariate Normally Distributed, that is:
$$ \vec{x} \sim MVN(\vec{\mu}, \Sigma) $$where $\Sigma$ is a square, symmetric matrix.
This test is implemented below.
## Hotelling's t-test for multivariate normal.

prob_null <- function(data, hypothesized_mean_vector) {
  n = nrow(data)
  p = ncol(data)
  tsqobs <- hotellings_tsq_statistic(data, hypothesized_mean_vector)
  f_dist <- hotellings_f_statistic_trans(tsqobs, n, p)

  return(1 - pf(f_dist['f'], f_dist['df1'], f_dist['df2']))
}

hotellings_f_statistic_trans <- function(tsqobs, n, p) {
  f <- ((n - p)/(p*(n - 1))) * tsqobs
  df1 <- p
  df2 <- n - p
  return(c(f = f,df1 = df1,df2 = df2))
}

hotellings_tsq_statistic <- function(data, hypothesized_mean_vector) {
  sample_mean <- apply(data,2,mean)
  sample_covar <- cov(data)

  S_inv <- solve(sample_covar)
  n <- nrow(data)
  mu <- hypothesized_mean_vector

  tsqobs <- n*t(sample_mean - mu) %*% S_inv %*% (sample_mean - mu)
  return(tsqobs)
}

find_discriminant <- function(data, hypothesized_mean_vector) {
  sample_mean <- apply(data,2,mean)
  sample_covar <- cov(data)

  discriminant <- solve(sample_covar) %*% (sample_mean - hypothesized_mean_vector)
  return(discriminant)
}
response_data <- matrix(c(51,27,37,42,27,
                          43,41,38,36,26,
                          29,36,20,22,36,
                          18,32,22,21,23,
                          31,20,50,26,41,
                          32,33,43,36,31,
                          27,31,25,35,17,
                          37,34,14,35,25,
                          20,25,32,26,42,
                          27,30,27,29,40,
                          38,16,28,36,25),ncol = 5)
hypothesized_mean <- c(30,25,40,25,30)
response_data

prob_null(response_data, hypothesized_mean)
find_discriminant(response_data, hypothesized_mean)
From this, because the p value is less than .05, we reject the hypothesis that this data comes from a normally distributed population with mean vector: $$ \vec{\mu} = \begin{bmatrix} 30 \\ 25 \\ 40 \\ 25 \\ 30 \end{bmatrix} $$
The discriminant indicates that the third variable contributes most to the difference between the hypothesized and sample mean.
require(MASS)
ex <- mvrnorm(11, mu = hypothesized_mean, Sigma = cov(response_data))
prob_null(ex, hypothesized_mean)
find_discriminant(ex, hypothesized_mean)
Now we see that a multivariate normal distribution sampled with mean equal to the hypothesized mean and Sigma equal to the covariance of the observed data provides unsignificant results -- as expected.
Now, let's see the t-test for the equality of means, assuming an equal covariance matrix and sample sizes.
differences <- response_data - ex
prob_null(differences, rep(0,5))
find_discriminant(differences, rep(0,5))
We see the expected result: that the two samples produce significant results -- meaning that there is evidence to reject the null hypothesis that they come from a distribution with the same mean vector.
